In the U.S. 99% of counties have experienced a flood event, yet the vast majority of homeowners remain unprotected because they rely on a "low-risk" property label even though it is often years out of date. In this second installment of our Flood Success Stories series, we go into the tactics our top-performing flood agents use to overcome the Zone X objection.
By highlighting the gap between map designations and modern environmental realities, agents Chance Hazeltine (Sarasota, FL), Jordan Altenhof (Rockledge, FL), and Matthew Brooks (Biloxi, MS) turn a client's biggest misconception into a bound policy.
The Zone X Trap: Why "Low Risk" is a High-Stakes Gamble
A major hurdle in the flood conversation is a false sense of security. Currently, 96% of homeowners remain uninsured for flood, with many of them believing their FEMA designation gives them a pass on needing coverage. However, Chance, Jordan, and Matthew discussed in our recent listening sessions how, while FEMA Flood Insurance Rate Maps (FIRMs) are the industry standard, they are frequently dated.
The process of remapping a community involves complex hydraulic modeling and a lengthy legislative appeals process, meaning maps often lag 5 to 10 years behind actual land development.
"I tell my clients that a flood map is like a weather report from five years ago," says Matthew (Biloxi, MS). "It doesn't account for the new shopping center or the housing development two miles away that just replaced 50 acres of soil with concrete."
Why Classifications Fail Your Clients
Flood risk zones are determined by statistical probability based on historical data. They do not account for:
- Infrastructure stress: Local drainage systems are often built for past rainfall patterns, not the 100-year storms that now happen with increasing frequency.
- Impervious surfaces: New construction creates runoff that the ground can no longer absorb, pushing water into areas previously considered safe.
- The 40% reality: More than 40% of all flood claims come from outside of high-risk zones.
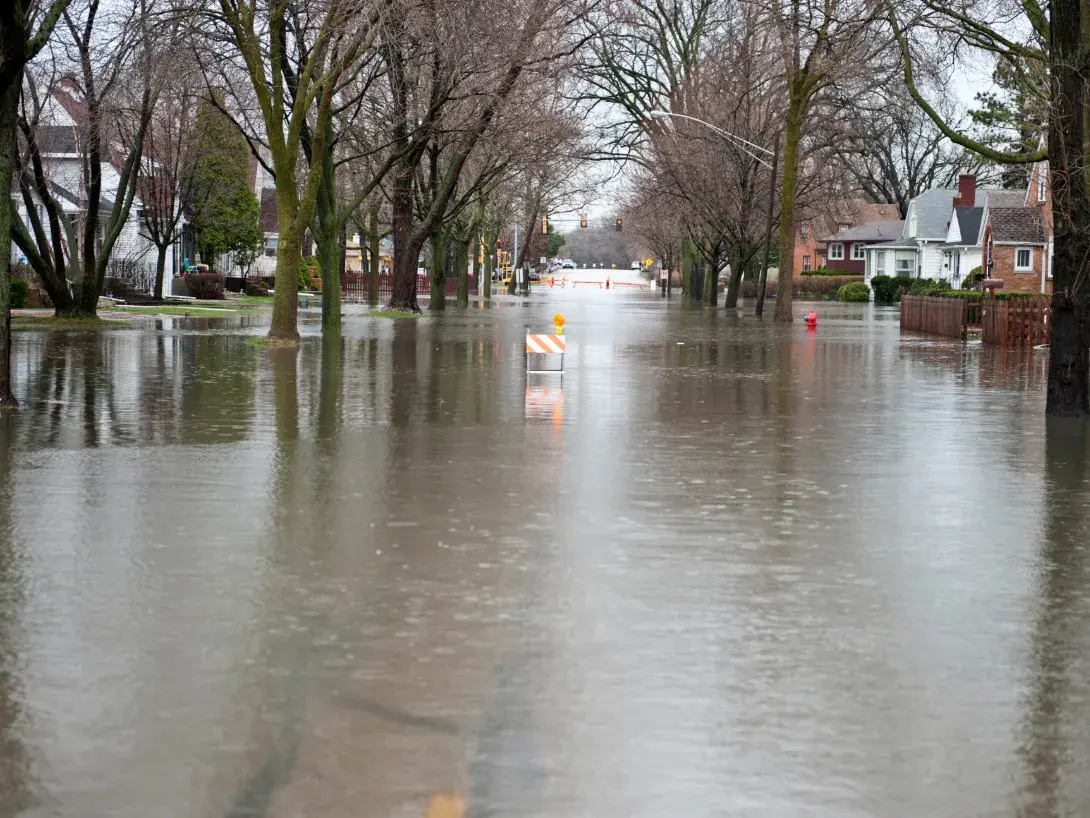
Real-World Scenario: When Safe Zones Fail
The dangers of relying on old risk maps aren't theoretical. In August 2025, a flash flood swept across El Paso, Texas, turning roads into rivers and submerging vehicles in minutes. The area was a classic "Zone X" trap: a desert environment where many residents felt immune to flood risk, backed by a FEMA map that hadn't been fully updated in decades.
What caught homeowners off guard wasn't just the rain, but infrastructure overload.
- Engineering limits: Even perfectly maintained drainage systems can be overwhelmed by sudden, high-intensity monsoon storms.
- The debris factor: Local development often causes runoff to carry rocks, mud, and construction debris into the drains, clogging the very systems meant to protect the neighborhood.
- In these dry climates, the ground is often too hard to absorb sudden heavy downpours, leading to immediate flash flooding.
Chance in FL uses this logic to pivot the conversation: "If it rains where you live, you’re in a flood zone. The map just tells you how much the government cares about it. I care about your equity."
The Strategy: Precision Over Guesswork
Conversely, what can be relied upon is Orion180’s rooftop-level geocoding, which uses precision data to pinpoint risk specific to the individual property and in real time.
How Geocoding Changes the Conversation:
- Precision location: Our model pinpoints the exact rooftop coordinates, looking past broad zone lines to analyze the specific terrain of that property.
- Elevation intelligence: We identify homes built even slightly above the base flood elevation (BFE), which often qualifies them for lower premiums due to reduced exposure.
- Topography & depth: We analyze natural and man-made features and use advanced flood-depth data to find homes with naturally lower risk, even if they are near the coast.
By using this data, you can show a client in a safe zone exactly why their specific home is—or isn't—protected from the surrounding topography.
Don't let an outdated map dictate your client’s financial future.
Ready to run a precision quote? Log into MY180 today and show your clients why Orion180 is the better flood solution.
Read Part 1 of our series here, and watch this space for more insights from our Top Flood Producers. We’ll dissect why it’s always a good time to talk to clients about Flood Insurance.